In the world of sales operations, precision is everything. You don’t make a move without intel. You don’t make a call without numbers. And you certainly don’t spend 73% of your time supporting non-sales functions without asking: Is this mission still on course?
But KPIs? They aren’t just numbers. They’re your gadgets. Your encrypted messages. Your license to scale.
So whether you're trying to uncover inefficiencies in the pipeline, align sales and marketing like clockwork, or just make it to quarter-end without breaking a sweat, these are the KPIs that should be on your radar. Every. Single. Day.
Key takeaways
- KPIs in sales operations are essential for tracking pipeline health, rep efficiency, and forecast reliability, helping to optimize processes and drive results. These metrics guide strategic decisions and ensure that sales operations stay on track.
- Important KPIs include Lead Conversion Rate, Sales Cycle Length, Pipeline Coverage Ratio, and Forecast Accuracy. Tracking these allows Sales Ops to spot inefficiencies, refine sales methodologies, and forecast future revenue more accurately.
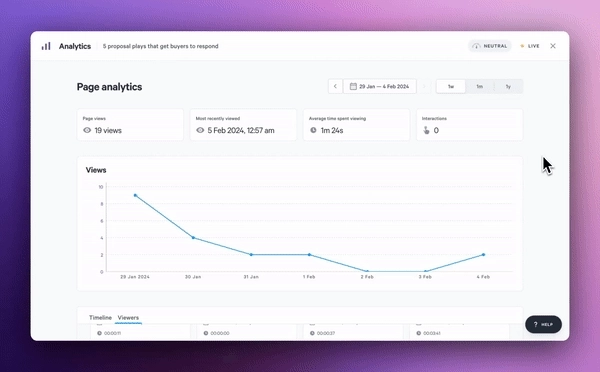
- Qwilr transforms proposal tracking: By integrating with your CRM, Qwilr tracks proposal engagement and correlates it with sales outcomes. It helps refine content strategy, improve rep performance, and boost forecasting accuracy, ultimately enhancing the effectiveness of Sales Ops KPIs.
What are sales ops KPIs?
Sales operations KPIs (key performance indicators) are the metrics that matter most for tracking and enhancing the performance of your revenue engine. They aren't vanity metrics. These are the operational pulse points that tell you whether your systems are lean or bloated, your pipeline is solid or slipping, and your forecasts are prophetic or just polite lies.
From pipeline health to rep performance, Sales Ops KPIs are about optimizing processes, not just celebrating outcomes. They guide strategic decisions, allocate resources, and ultimately serve as the control center of your sales organization.
Sales operations vs. sales enablement
Though they often work shoulder-to-shoulder, sales operations and sales enablement play distinctly different roles within a revenue team. Sales operations is the strategic core - it owns the infrastructure, the data, the systems, and the efficiency of your sales process. They are the ones building the blueprint, aligning systems, and ensuring that revenue goals are more than just hope wrapped in a slide deck.
Sales enablement, on the other hand, is the tactical armory. This team equips reps with the tools, training, content, and coaching they need to execute. If Sales Ops is MI6 command, sales enablement is Q’s lab, arming your team with every possible advantage to win the deal. Both are essential. But only one is watching every move, calibrating the machine behind the mission.
Why sales ops metrics matter
Put it this way: Without measurable KPIs, sales organizations run on intuition and adrenaline. With them, you run on clarity, discipline, and results.
KPIs tell you whether your deals are big enough, your pipeline is accurate enough, your reps are fast enough, and your forecasts are on point to deliver what the boardroom expects. (P.S. more on this later)
They're how you scale operations, diagnose inefficiencies, justify headcount, and prove that every decision you make is rooted in data. In short, KPIs give sales operations its authority—and, of course, its edge.
In Sales Ops, KPIs track:
- Pipeline health
- Rep efficiency
- Process bottlenecks
- Forecast reliability
- Revenue predictability
How to set up sales ops KPIs
The setup matters just as much as the data! You don’t just start tracking metrics and hope for insight.
- First, align every KPI to a business objective, whether it's shortening the sales cycle, increasing deal size, or improving forecast accuracy.
- Next, select only the metrics that offer real leverage. Less is more. Ten sharp KPIs are better than thirty dull ones.
- Then, clean your data. A messy CRM turns KPIs into fiction.
- Centralize your reporting, whether through a dashboard or BI tool, and make sure everyone’s working from the same definitions. Benchmark each metric against historical or industry data to create context.
- Finally, create a cadence: review, analyze, adjust. KPIs are not set-and-forget. They're living tools. Keep them close and keep them current.
Top sales ops KPIs to track
“You can tell a lot about a woman by the way she plays cards.” Sure can. You can tell even more about a revenue team by how it tracks these KPIs.
Lead Conversion Rate
Lead Conversion Rate = (Number of leads converted to customers ÷ Number of qualified leads) × 100
Lead Conversion Rate is the first red flag or green light in your sales funnel. It measures the percentage of qualified leads that actually become customers. If the rate is low, you may have a marketing problem, a qualification gap, or a sales process that's leaking trust faster than a defective Aston Martin.
If it's high, it means your team is engaging the right prospects, saying the right things, and closing with precision.
This KPI directly reflects the effectiveness of your lead scoring model and sales qualification process. It’s not just about volume, it’s about quality and readiness to buy.
Qwilr can help improve this by tracking which proposals get viewed and engaged with, adding a behavioural layer to your lead scoring model.
Sales Cycle Length
Sales Cycle Length = Total number of days to close deals ÷ Number of deals closed
Speed is a strategic weapon, and your sales cycle length tells you how fast - or sluggish - your team is moving. It measures the average time it takes to close a deal from first contact to signed contract.
A long cycle may indicate indecision, poor qualification, or friction in the sales process. A shorter cycle means your team is creating urgency, controlling the narrative, and eliminating roadblocks.
This KPI is also deeply tied to sales velocity and forecasting. Knowing how long your team typically takes to close can help predict future revenue and identify lagging opportunities.
Pipeline Coverage Ratio
Pipeline Coverage Ratio = Total pipeline value ÷ sales target
This is your early-warning system.
First things first: Using Qwilr’s pipeline report allows any organization to gain a better understanding of how deals are progressing through the funnel. Over time, sales leaders and their teams can understand the effectiveness of their sales process.
Pipeline Coverage Ratio shows how much potential revenue is currently in the pipeline compared to the quota your team is expected to hit. A 3:1 ratio is typically the sweet spot for consistent performance. Fall below that, and you’re under fire with too few bullets. Go above that, and you might be chasing ghosts - overstuffing the pipeline with low-probability deals.
This KPI ensures your sales team isn’t walking into a gunfight with a butter knife. It lets leadership sleep at night, knowing there's enough in play to cover the number.

Win Rate
Sales Win Rate = (Number of Won Opportunities ÷ Total Number of Opportunities) × 100
This metric doesn’t lie.
Win rate tells you how many deals your team actually closes compared to how many they pursue. A high win rate means your reps are targeting the right accounts, handling objections like pros, and walking into meetings with solutions, not sales pitches. A low win rate could mean poor qualification, product-market misalignment, or weak follow-up.
It also helps you understand the effectiveness of your sales methodology. Every win and every loss holds data.
This KPI captures the truth and asks: Are we as good as we think we are?
Forecast Accuracy
Forecast Accuracy = (Forecasted revenue – Actual revenue) ÷ Forecasted revenue × 100
A forecast is a promise.
This KPI tells you how often that promise is kept. Forecast Accuracy compares your projected revenue to actual closed revenue. Get this wrong too often, and you lose executive trust, derail budgeting, and make the CFO’s eye twitch. High forecast accuracy means your pipeline stages are solid, your reps aren’t overly optimistic, and your deal slippage is under control. It also means Sales Ops is doing its job: bringing science to what others call art.
Looking for a quick forecasting solution? Check out Qwilr’s sales growth rate calculator
Average Deal Size
Average Deal Size = Total revenue from closed deals ÷ Number of deals closed
Average Deal Size reveals how much revenue you’re typically generating per sale.
If your average deal size is shrinking, it could be a sign that your team is going after the wrong segment, discounting too heavily, or struggling to articulate value. If it’s growing, you’re probably climbing upstream—targeting bigger accounts, bundling smartly, and selling with confidence.
This KPI is also essential for planning and prioritization. It influences territory design, rep quotas, and forecasting. And when combined with win rate and sales cycle, it feeds into that holy grail of metrics: sales velocity.
Want to influence your Average Deal Size? Qwilr helps your reps present value-packed proposals that look like a million bucks—even if the deal’s only worth half that. It’s easier to charge more when you show up like you’re worth more.
Rep Ramp Time
Rep Ramp Time = Time from rep hire to hitting full quota or target productivity
Every new hire is an investment.
Rep Ramp Time measures how long it takes a new salesperson to reach full productivity. A long ramp drains resources. A short ramp means your onboarding and enablement programs are built like precision machinery. This KPI helps you optimize hiring plans and project future performance. It also reveals whether your enablement content, product training, and coaching efforts are actually sticking.
In fast-scaling companies, this metric can be the difference between chaos and controlled growth. Look at how quickly new reps are sending and customising proposals and whether engagement levels are consistent with top performers.
Qwilr’s proposal software can support faster onboarding by reducing admin lift and ensuring consistency across your sales collateral. Instead of starting from scratch or hunting down the “latest version” of a proposal, new reps can plug into pre-approved, on-brand templates that are ready to go. It shortens the ramp-up time, minimizes errors, and frees up time for more strategic selling.
Plus, templates can be version-controlled and updated centrally, so your entire team is always aligned with the latest messaging and offers. No copy-paste chaos is required.
Sales Productivity
Sales Productivity = Revenue per rep ÷ Time period (monthly or quarterly)
Sales productivity is all about revenue per rep. It filters out noise and answers one simple question: are your people performing?
This metric compares output (usually in revenue) against input (time, effort, activity volume). Low productivity might suggest misaligned territories, too much admin work, or a lack of focus. High productivity points to sharp processes, strong enablement, and clear incentive alignment.
If reps are spending hours formatting decks and chasing approvals, you’ve got a problem. This KPI keeps the team honest and the incentives focused.

Customer Churn Rate
Customer Churn Rate = (Customers lost during a time period ÷ Total customers at the start of the period) × 100
The Customer Churn Rate tracks the percentage of customers who stop doing business with you over a specific time frame. It may not sit directly in the sales function, but it's a KPI Sales Ops can’t afford to ignore. Why? Because a leaky bucket can't be filled, no matter how fast you pour.
Churn reveals post-sale dissatisfaction, misaligned expectations during the deal, or structural problems in pricing or onboarding. Monitor it closely! (It’s a silent killer of scale)
Deal Slippage
Deal Slippage = (Number of deals pushed to the next quarter ÷ Total forecasted deals) × 100
Every sales leader knows this pain: deals forecasted to close this quarter quietly vanish into next quarter’s pipeline. Deal Slippage measures how often that happens and how much revenue is being delayed. It’s not just about missed numbers; it’s about credibility.
Frequent slippage may mean your reps are rushing deals into the forecast to please leadership or are overly confident about customer intent.
This KPI shines a light on forecast hygiene, process discipline, and rep accountability.
What skills do sales operations need to succeed?
It’s a fair question. Sales Ops professionals are more than spreadsheet whisperers. They’re systems thinkers, data tacticians, and process engineers rolled into one.
- Analytical thinking: Sales Ops must be able to spot patterns in messy data, make sense of incomplete information, and draw actionable conclusions - fast.
- CRM Expertise: Mastery of tools like Salesforce isn’t optional. You’re building, maintaining, and optimizing the system that drives your entire sales engine.
- Forecasting fluency: Great operators blend historical data with intuition. Forecasting isn’t just math, it’s part science, part gut check. (So poetic).
- Project management: From tool rollouts to process redesigns, Sales Ops often plays quarterback. Prioritizing, planning, and keeping cross-functional teams aligned are key.
- Communication skills: It’s not enough to find the insight. You need to translate it. The ability to simplify complexity and influence decisions is a superpower.
- Systems thinking: Sales Ops pros see the bigger picture. They understand how tools, teams, and processes connect - and how to make them run smoothly together.
- Tactical execution: It’s not all strategy. Sales Ops must also get their hands dirty in the details, whether it’s cleaning data, testing automations, or troubleshooting tools.
How Qwilr gives sales ops sharper intel
Beyond proposal views and engagement metrics, Qwilr becomes a silent operator in your tech stack. The result? Sales Ops turn documents into data.
Sync Qwilr with your CRM to gain deeper insights into proposal performance and pipeline movement. We know that in a SaaS environment, speed and scalability are crucial.
- Track proposal engagement to correlate buyer behavior with closed-won/lost outcomes, spotting potential wins or stalls early.
- Monitor proposal timing to ensure reps follow your sales methodology and process.
- Measure content effectiveness by tracking which templates drive the most engagement, improving rep productivity and scaling high-performing content.
- Refine onboarding by identifying which templates accelerate new rep ramp-up, boosting productivity.
- Improve forecast accuracy by comparing buyer interactions with rep forecasts to detect overconfidence or sandbagging.
About the author

Brendan Connaughton|Head of Growth Marketing
Brendan heads up growth marketing and demand generation at Qwilr, overseeing performance marketing, SEO, and lifecycle initiatives. Brendan has been instrumental in developing go-to-market functions for a number of high-growth startups and challenger brands.