The most valuable metrics provide actionable insights. Explore how tracking sales velocity can help to improve the performance of growing sales teams.
The value of tracking your sales velocity score
You wouldn’t run a business without key metrics, or KPIs, to guide you on what’s working and what isn’t. The same logic applies to sales teams: without analyzing data such as win rates, sales cycle length, average deal values and conversion rates, you don’t know if you’re doing the right things to achieve business growth.
These sales metrics on their own provide valuable insights that can identify strengths and weaknesses in your go-to-market approach. And when combined together into a sales velocity score, sales teams can utilize the insights gleaned to turbocharge their performance.
In this blog, we explore how tracking sales velocity provides valuable insights to improve the results of growing sales teams.
What is sales velocity and why is it important to your sales cycle?
Sales velocity measures how quickly deals move through your pipeline and generate revenue, and is a valuable indicator of pipeline health. It considers the number of opportunities, average deal size, win rate (or conversion rate), and length of the sales cycle.
You may have seen this sales metric represented as a formula:
Sales Velocity Formula
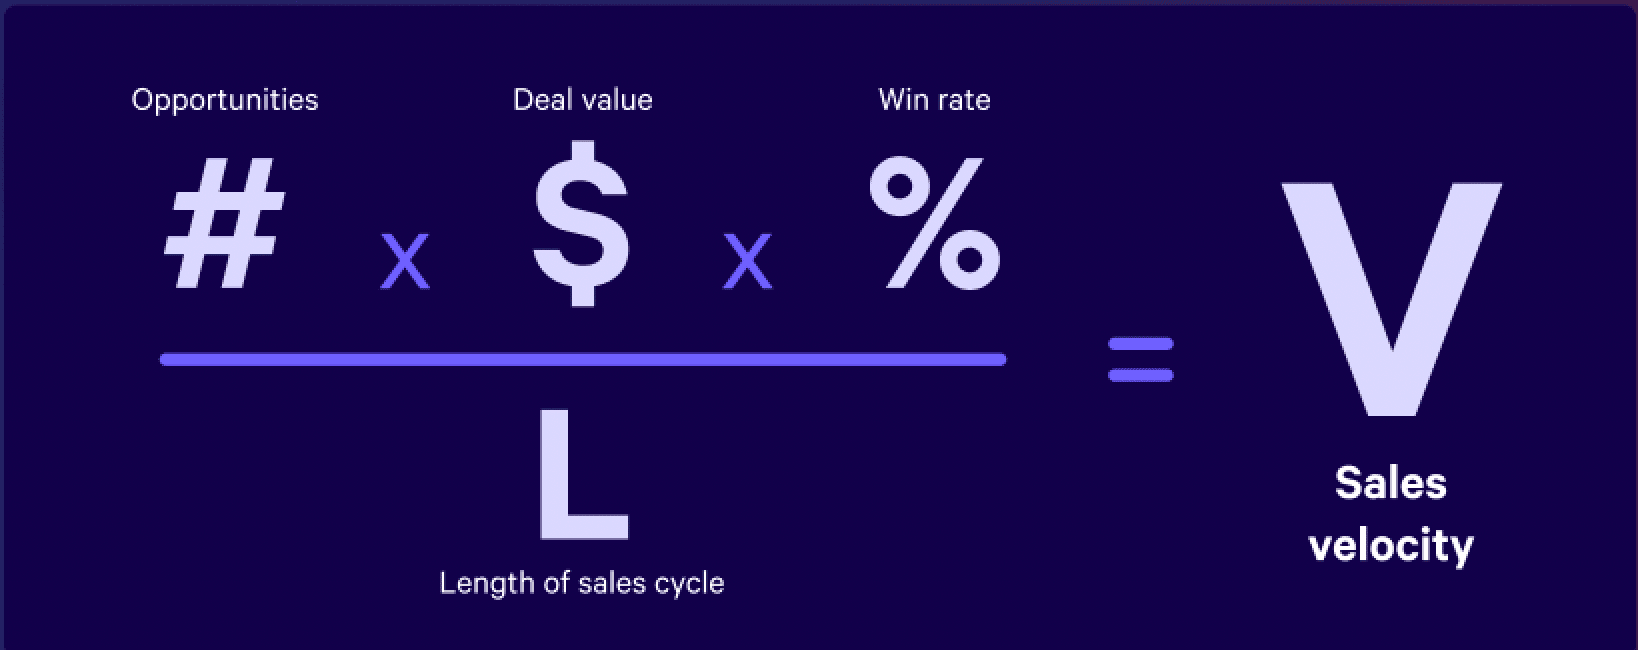
To calculate sales velocity, simply multiply the number of opportunities within a set period of time by the average deal value, then multiply by the win rate. Divide that figure by the average length of the sales cycle within the same period and eureka – you have your score. The higher the number, the quicker you are moving customers through the sales pipeline.
For example (time period = one quarter):
| # opportunities | Avg deal value | Win rate | Length of the sales cycle | Sales Velocity |
|---|---|---|---|---|
20 | 5000 | 20% | 25 days | 800 |
15 | 15000 | 5% | 25 days | 450 |
Examples of calculating sales velocity
Want to know how your score ranks? Use Qwilr’s Sales Velocity Calculator to see how your team’s performance stacks up against benchmark data from 800+ B2B companies >
Sales velocity is an important metric that sales teams should track and evaluate on a regular basis, over a consistent period of time, to measure ongoing team and individual efficiency. It’s also a useful metric to track before and after a change in your sales process, so you can determine whether the change had a positive impact on the sales funnel, or not.
Yet sales velocity is more than a metric of good vs bad. Its insights can be used to help validate quota and revenue goals, level-up individual sales performance and identify opportunities to optimize your sales strategy and boost performance.
Optimize your sales strategy
Examining the metrics that determine sales velocity enables sales managers and their teams to optimize the sales strategy to close deals faster. Let’s explore what these metrics are, and how they can optimize the sales pipeline.
Number of opportunities
This is the number of opportunities you have in your CRM across the period of time you are measuring.
Closing deals and growing your business is a numbers game – the more you put in, the more you get out. A shortage of qualified leads will always lead to a deficit in the number of sales opportunities you need to increase sales velocity, and ultimately revenue. However, an abundance of unqualified leads won’t solve the problem either! Only quality leads generate paying customers. Keep that top of mind when building pipeline, and ensure that your salespeople are working as efficiently as possible to follow up and qualify leads in and out. As a rule of thumb, a smaller number of qualified opportunities is far better than a pipeline stuffed with duds.
Average deal size/value
Establish your average deal size by dividing the total value of deals won over a set period of time, by the total number of deals.
If you think that your average deal value is a weak link in your sales velocity score, explore strategies to increase it. This may be finding opportunities to upsell through bundled offerings, or targeting larger customer accounts to increase deal size.
Win rates
The win rate, or conversion rate, represents the average percentage of deals that were closed-won over your set period of time. Divide the total number of opportunities generated in your set period of time, by the number of those that were closed-won deals to calculate your win rate.
You can assume that your win rate is a reflection of lead quality, but while this is a factor it is also an indication of how successful your approach to sales is. Teams or individuals with lower win rates may find it valuable to explore where in the sales funnel deals are exiting, to identify and resolve the root cause.
Average sales cycles
The length of your sales cycle is the number of days it takes for a prospect to progress from a qualified lead or opportunity to a closed-won deal in your CRM.
Sales cycles are often affected by circumstances beyond a sales rep’s control. A shift in priorities or a loss of budget can extend the sales cycle for much longer than expected. However, inefficiencies in your sales process could also be hindering the speed at which deals close. If this is an area for improvement, consider what steps in the process are cumbersome and look for opportunities to automate admin tasks that waste valuable time for your team and your customers.
Sales velocity and revenue goals
Understanding the sales velocity score can help sales leaders to plan and validate revenue goals. Using the formula, you can basically calculate your team’s earning power over a set time frame. If there is a disparity between their total earning power and your set revenue goals, you have two choices. Either push back on revenue goals or find a way to increase your sales team’s velocity. We know which convo we’d rather have!
Sales velocity and individual sales performance
Some sales managers opt to use sales velocity not to just measure their sales teams’ performance, but also that of the individual sales reps by ranking each of their territory’s scores. Be warned, depending on your go-to-market model, it may be like comparing apples and oranges. Reps of course need to be assessed ‘like for like’, so avoid comparing salespeople who operate in different markets eg. enterprise vs SME, or have other such factors that can impact deal size, conversion rates or deal volume. By assessing individual sales velocity you can identify inhibitors to their sales success. For example, reps with lower win rates may need further enablement training.
While providing tangible insights into individual sellers’ behaviors, ranking individuals can also be used as an additional metric to recognize and reward those with consistently higher sales velocity. Besides, who doesn’t like a little healthy competition?
Any sales manager worth their salt is constantly seeking ways to improve the bottom line. If measuring sales velocity isn’t part of your current sales management toolkit, now is the time to start.
Try Qwilr's Sales Velocity Calculator
Compare your sales performance against benchmark data from 800+ B2B companies, with recommendations on how to speed up sales cycles and increase win rates.
About the author

Sarah Taylor|Senior Content Marketing Manager
Sarah leads Qwilr's content marketing efforts – specialising in field marketing, campaign planning, content, brand and communications. Sarah has both agency and global corporate experience spanning Australia, Asia and the UK.