Sales data doesn't lie—but it doesn't always speak for itself. The difference between hitting sales targets and missing opportunities comes down to how well you interpret the numbers.
A 30% drop-off between demo and proposal stages. Lower close rates with financial services prospects. A high-volume product with low margins. Sales analysis pinpoints exactly where to focus.
Whether you're a sales leader optimizing your sales team's performance or one of your sales reps looking to improve your close rate, you'll learn how to perform a sales data analysis and understand the key metrics to track.
Key takeaways
- Effective sales analysis requires setting clear goals and asking specific questions relevant to your business stage rather than analyzing random data.
- Regular monitoring at multiple time intervals (daily, monthly, quarterly, and annually) creates a feedback loop that catches problems early and enables quick course corrections.
- Sales analysis should incorporate multiple methods including trend analysis, performance analysis, pipeline analysis, predictive analysis, and customer analysis to gain comprehensive insights.
- Clean, reliable data from integrated sources (CRM, analytics software, revenue intelligence systems) is essential for meaningful sales analysis and decision-making.
- Converting insights into action plans with measurable experiments, stakeholder-specific deliverables, and established feedback loops is essential for sales analysis to drive actual revenue growth.
What is sales analysis, and what does it include?
Sales analytics involves tracking key metrics like revenue growth, conversion rates, and customer acquisition costs, identifying patterns, and using these insights to improve sales strategies and close more deals.
It includes:
- Revenue trends by product, region, and time period
- Customer buying behaviors, preferences, and churn risks
- Team performance metrics, including quota attainment and deal velocity
- Sales cycle length and efficiency, highlighting delays and bottlenecks
- Market response to pricing changes and promotional campaigns
Sales analysis isn’t about pulling unread sales reports, creating impressive-looking charts with no real insights, or checking off a box at the end of the quarter.
An ongoing sales analysis process uncovers actionable insights to refine sales strategies and drive revenue growth.
While sales analytics helps you spot market trends before your competition, its value depends on consistent implementation and follow-through.
Are you performing a sales analysis frequently enough?
When did you last discover a fixable pipeline issue after missing your monthly target?
If you're analyzing sales data quarterly but operating on monthly quotas, you're essentially flying blind for 90 days at a time. The pressure to hit numbers doesn't wait for your analysis schedule.
As Ali Newton-Temperley, Agency RevOps Consultant at The Agency Growth Pad, notes, “Measure the inputs more than you measure the outputs.”
Daily tracking of leads generated, discovery calls completed, and proposals produced give you immediate indicators of whether you're on the right track—before it's too late to course-correct.
A Varicent and Harvard Business Review report stresses the importance of regular sales analysis: fewer than half of sales teams meet their quotas, despite strong efforts and bigger investments in CRM and sales analysis tools.
Marc Altshuller, CEO of Varicent, points out, “If fundamental elements such as territories, quotas and incentive compensation are not aligned from the start, teams struggle to reach their targets.”
Build analysis into your sales organization routine at multiple levels:

A multi-layered approach creates a feedback loop where problems are caught early and fixed quickly.
How to perform a sales analysis
Creating a detailed sales analysis report doesn't have to be complicated, but it does require a structured approach and the right sales analysis tools.
The process begins with collecting clean, reliable data from your CRM and other sales analysis tools, then moves through a series of focused steps designed to extract valuable insights.
1. Set clear sales goals for your analysis
Most sales and marketing teams dive into spreadsheets, convinced they're making data-driven decisions—only to waste hours analyzing the wrong numbers.
The problem? They don’t start with the right questions.
Don't just say “I want to improve sales.” Instead, ask “Why did our deal win rate drop by 12% last quarter?”
“It really depends on the industry and team size as well as the business's growth stage,” notes Ali. “Typically, earlier stage teams have to focus heavily on being agile and analyzing as they go. The quantitative analysis is often less informative as there is little historical sales data to go on.”
Take a SaaS startup—they might want to figure out:
- Which feature demos lead to the fastest conversions?
- Do 30-day or 14-day trials produce higher-quality leads?
- Which customer profiles have the shortest sales cycle length?
Meanwhile, enterprise SaaS sales have a different focus: As Ali points out, “More established businesses can get lured into over-focusing on quantitative sales data and expecting their data comparisons to continue in the ways that they have done in the past.”
A mature marketing agency, for instance, might analyze:
- How does historical client retention compare to recent project-based vs. retainer conversions?
- Which performs better—traditional service packages or emerging digital offerings?
- Do their tried-and-true client acquisition methods still outperform newer approaches?
Bottom line? Match your questions to where your business is right now—but keep your eyes open for when things start to shift.
2. Choose the right sales analysis methods
Setting clear goals is only the beginning. Using the right type of sales analysis method determines whether you find deep insights or just skim the surface.
Focus on these types of sales analysis reports:
- Sales trend analysis tracks performance over time, revealing patterns, sales cycles, and long-term trends. Analyzing sales data over weeks, months, or years exposes seasonal trends, growth patterns, and market shifts. This historical perspective helps contextualize current performance and detect early signs of trouble.
- Sales performance analysis evaluates individual and team effectiveness against targets and key performance indicators (KPIs). Beyond revenue numbers, it examines sales activities, conversion rates, and productivity indicators. It highlights top performers' best practices and pinpoints skill gaps or training needs for underperforming sales reps.
- Sales pipeline analysis examines how opportunities move through your sales process. You can identify where prospects get stuck or drop out by tracking conversion rates between stages, average deal size, and time-in-stage metrics. This helps refine your sales methodology and fix bottlenecks that slow down deals.
- Predictive sales analysis uses past sales data to forecast future sales. From basic trend projections to advanced statistical modeling, these methods help anticipate market changes, project revenue, and identify high-potential opportunities. Accurate predictions support better resource allocation and business planning.
- Customer analysis segments your buyer base to identify patterns in purchasing behavior, profitability, and retention. It reveals which customer profiles bring the highest customer lifetime value, which acquisition channels deliver the best ROI, and what factors influence buying decisions. These insights help focus sales efforts on the most promising market segments.
Beyond traditional types of sales analysis, forward-thinking sales reps use Continuous Intelligence (CI) to analyze customer interactions in real time.
Every call, email, and meeting note holds hidden patterns your team could be missing.
You can spot recurring complaints by analyzing customer chats and emails, uncover sales opportunities, and predict churn risks. Ultimately, your team responds faster, closes more deals, and boosts retention rates.
3. Collect and organize your sales data
Sales data analysis demands actual, messy data—not just the numbers that make you look good.
Getting clean, reliable sales data remains a major hurdle for many teams. A study from Gartner highlighted how 53% of organizations blame their sales problems on data that's either wrong or missing important details.
It's not just crucial to gather information but to make sure it's accurate and complete across all your sales dashboards.
Look into these sales tracking tools:
- Customer relationship management (CRM) platforms like Salesforce, HubSpot, or Pipedrive act as your digital memory bank—tracking every interaction, quote, objection, and follow-up that moves a deal forward (or stalls it).
- Sales analytics software like Outreach, SalesLoft, and Apollo quantify exactly how many touches it takes to get a response—and measure whether your subject lines spark interest or get ignored.
- Revenue intelligence systems like Clari, Gong, and Chorus transcribe and analyze sales conversations, flagging competitor mentions or sudden spikes in discount requests.
- Proposal tracking software and sales intelligence tools like Qwilr expose the harsh truth—prospects might spend three minutes scrutinizing your pricing table but skip your case studies altogether.
The real work starts when these tools stop talking past each other and start connecting dots between a prospect's proposal hesitation and their objections on recorded calls.
“Often marketing, sales and customer service data are held separately and this can lead to teams misunderstanding each other or important lead data being missed,” explains Ali
“Treating sales, marketing and customer service data as one 'revenue engine' can give the most power to producing good insights for all the teams involved.” This unified approach helps identify when drops in conversion rates actually stem from messaging disconnects or positioning issues elsewhere in your sales funnel.
Pro Tip: For every backward-looking metric on your dashboard, add a forward-looking one that predicts it. Ali suggests creating paired metrics—connecting each lagging indicator to the leading indicators that influence it.
For example, track weekly qualified opportunity creation and late-stage sales pipeline performance. These metrics tell you exactly how many discovery calls you need today to stay on track.
4. Turn insights into action plans
Found some amazing sales data? Great. Now do something with it. Sales insights only matter when they lead to actual changes in how you sell.
- Prioritize insights by impact potential - Score each finding on a simple 1-5 scale for potential revenue impact and implementation difficulty. Focus first on high-impact, low-effort changes.
- Create targeted deliverables for different stakeholders:
- For executives: One-page sales analysis reports with clear financial implications and two to three strategic recommendations
- For sales managers: Tactical playbooks with specific coaching points and performance metrics to monitor
- For sales reps: Simple cheat sheets with revised talk tracks or objection handlers based on sales data findings
- Design measurable experiments - Instead of wholesale changes, create small tests to validate your findings. Example: “For the next two weeks, half our team will try the new discovery questions we identified and track response rates.”
- Establish feedback loops - Schedule specific checkpoints (7, 30, 90 days) to measure whether changes produce the expected results.
- Visualize actionable sales data - Rather than just presenting raw numbers, use visuals that highlight performance gaps. A bar chart comparing conversion rates at each sales stage makes performance gaps obvious.

And sometimes, sales analysis uncovers surprises nobody saw coming—which is exactly the point.
For example: “I was coaching a sales team and there was a rep who was performing much lower than everyone else,” shares Ali.
“The basic numbers just showed he was struggling, not why. After digging through all their materials, I found one topic they weren't covering. It wasn't considered important by many on the team.”
The fix was shockingly simple: “We changed this one thing and the rep's performance became one of the team's strongest.”
The lesson? Sometimes it's the little things. Your job isn't done until someone acts on what you found.
Top sales analysis metrics you need to be tracking
Which revenue-driving sales metrics actually matter?
Tracking the right KPIs gives you visibility into your sales process at every level—from daily activities to long-term strategic outcomes. The key is organizing these metrics to provide actionable insights when needed.
Let's break down the essential sales metrics by time frame, showing you exactly what to measure daily, monthly, quarterly, and annually to maintain complete visibility into your sales team’s performance.
Daily/weekly tracking
Short-term metrics are your leading indicators—the numbers that tell you what's likely to happen before it happens.
Think of them as your early warning system—if your conversion rate suddenly dips, you'll know before it tanks your revenue.
Getting these metrics right means no more end-of-month surprises when you suddenly realize the team is way off target. Instead, you'll spot problems while there's still time to fix them.
Here's what you should monitor daily or weekly:

Monthly analysis metrics
Monthly analysis gives you enough data to spot meaningful patterns without waiting too long to act on them. This is where you'll find the story behind your numbers—not just what happened, but why it happened and what to do about it.
Monitor these monthly sales analysis report metrics:

Quarterly deep-dive indicators
Ever feel like you're so busy chasing this month's targets that you miss the bigger picture? That's exactly why quarterly analysis exists.
You can take a hard look at what's really happening in your market and see if your day-to-day sales hustle actually matches what your customers want now – not six months ago.
Let's look at the specific numbers that tell you whether you're on track:

Annual strategic metrics
Looking at your sales results once a year helps you see if all your hard work is growing your business in the long run.
These yearly numbers show you which customers stick around, which products truly make money, and where you're winning or losing ground against competitors. They tell you exactly where to focus your team's energy and budget next year for the biggest payoff.
Comparing sales figures year-over-year allows you to conduct an in-depth sales analysis to determine your net profit margin and overall business health.
Sales forecasting using past revenue trends and customer purchasing patterns helps you allocate budgets wisely, optimize inventory, and set realistic growth targets.

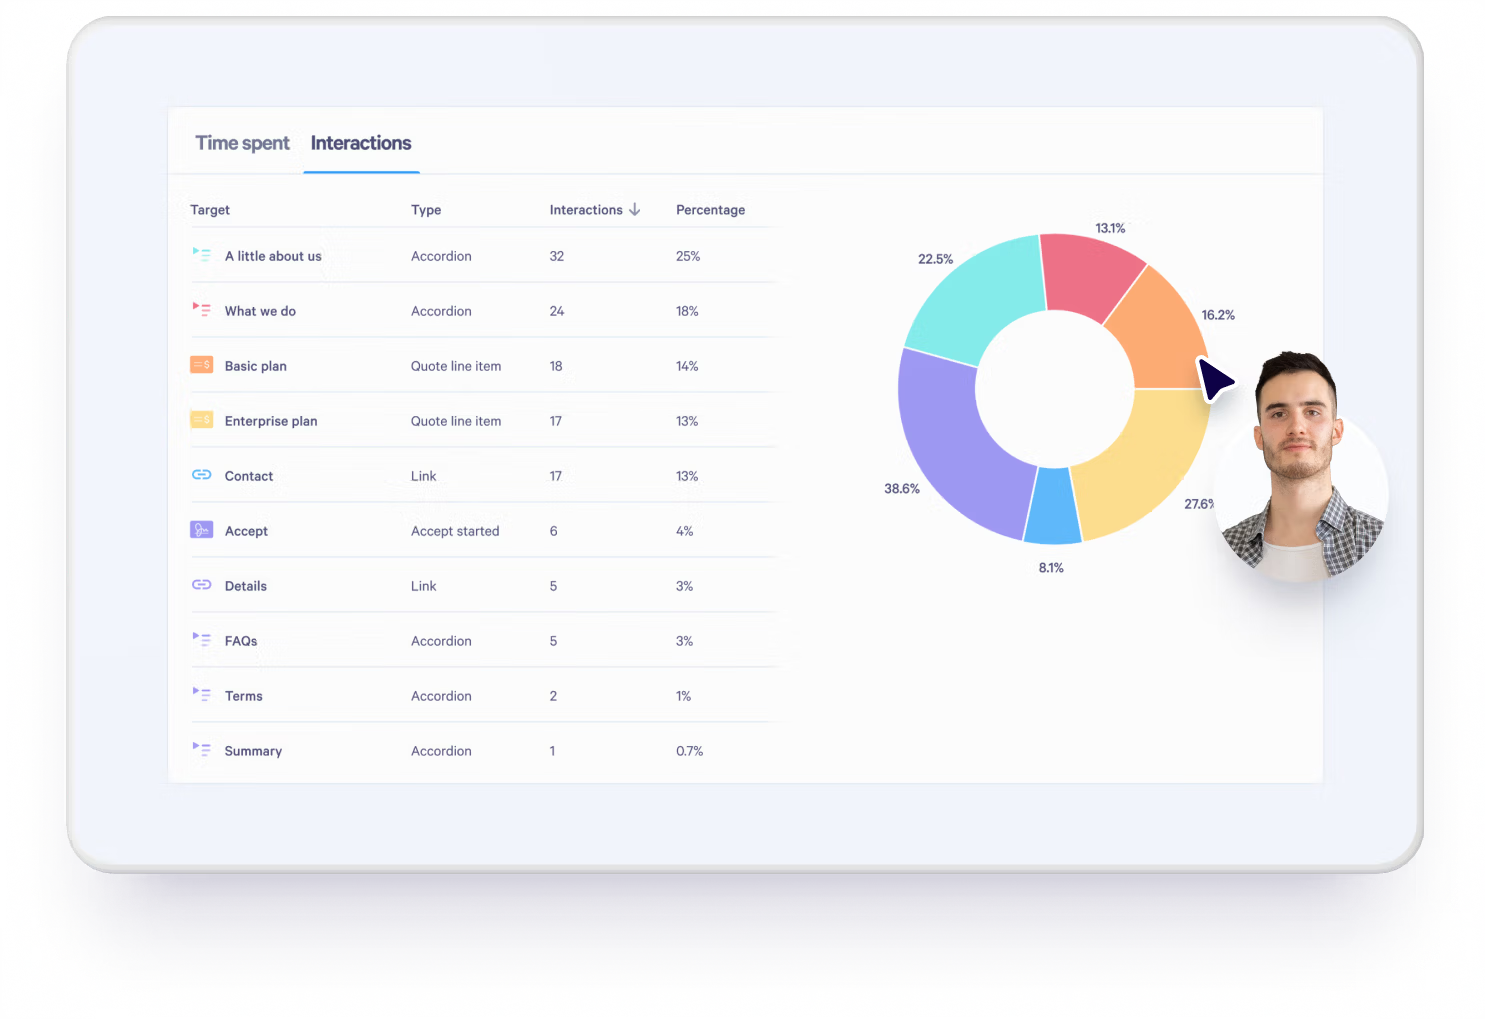
Improve sales analysis by tracking proposal engagement
Qwilr shows exactly what happens after you hit send on your sales documents. See when customers open your proposals, which sections grab their attention, and who they share them with—so you can follow up smarter.
Sync these insights with your customer database to see exactly what’s driving deals and double down on what works.
With Qwilr, sales teams don’t chase leads blindly—they follow real data, closing more deals by focusing on what buyers care about.
About the author

Kiran Shahid|Content Marketing Strategist
Kiran is a content marketing strategist with over nine years of experience creating research-driven content for B2B SaaS companies like HubSpot, Sprout Social, and Zapier. Her expertise in SEO, in-depth research, and data analysis allow her to create thought leadership for topics like AI, sales, productivity, content marketing, and ecommerce. When not writing, you can find her trying new foods and booking her next travel adventure."