Over the next few months, we’re giving Qwilr’s analytics capabilities a huge upgrade. That means a brand-new look. And more data to track on your Qwilr pages.
What’s New?
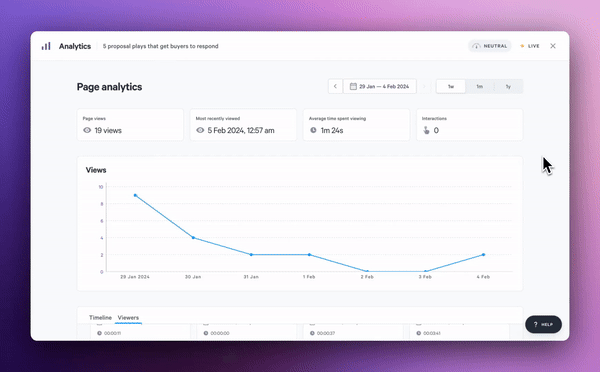
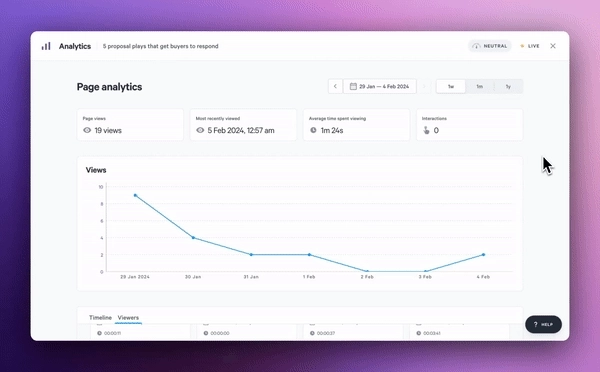
- How analytics looks for each Qwilr page got the biggest upgrade.
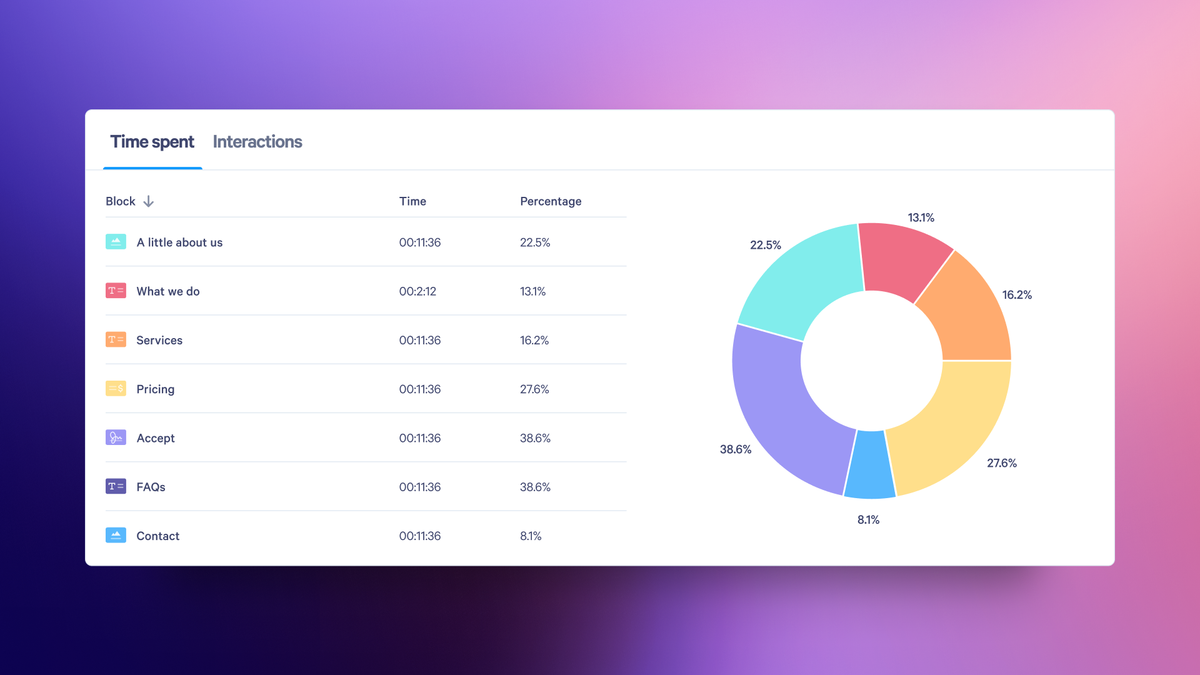
- We’ve added page views, most recently viewed, average time spent viewing, and the ability to track interactions (more on interactions soon) to the top of the analytics page.
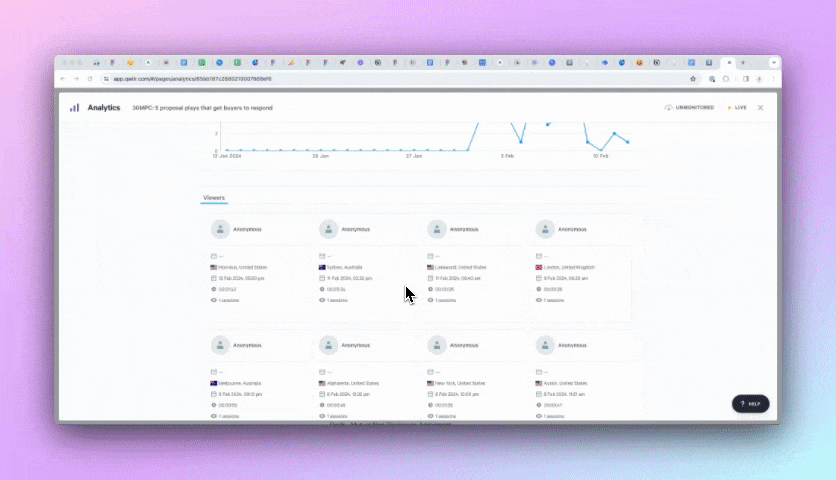
- A new tab for viewers helps you track the people who view a page and how often. Before this was based on the location of each viewer, not the person.
- Click into individual sessions and see all the session details, including the last action the viewer has taken.
- Filter by the last week, last month, or 12 months of data to see the views over time.
How to stay updated
To keep up with our newest features and releases, make sure to follow our Product Updates, and follow us on Linkedin.
Need more help understanding the newest features? Our customer support team is always available to answer questions and ensure you fully leverage all of the newest product features.
About the author

Tania Clarke|Head of Product Marketing
Tania heads up product marketing at Qwilr – looking after positioning, sales enablement, competitor intelligence and more. Tania brings experience from former roles at high growth startups like Atlassian and Safety Culture.