Over the next few months, we’re giving Qwilr’s analytics capabilities a huge upgrade. That means a brand-new look. And more data to track on your Qwilr pages.
Tracking something as simple as whether a document is opened or viewed is incredibly useful. With this knowledge, you’re able to strategically time follow-up or just feel comfortable knowing your proposal or document hasn’t been lost into the void!
Qwilr’s analytics updates take this a step further. Today Qwilr collects data on who is viewing your pages, how long they view, and what they click on. Coming soon, you’ll get much more detail on what exactly they’re doing on each page, and get notified about it.
Armed with data like this means instead of casting the net wide, you can spend your time following up with the prospects who show genuine interest. This is particularly useful if you have lots of proposals or different documents you send out. You can even tailor that follow-up based on what parts of your proposal they’re interacting with the most.
Below, I’ll walk you through the new features and provide insight into features we’ll be releasing in the coming months.
What’s New?
A new look for analytics
How analytics looks for each Qwilr page got the biggest upgrade. Overall, it looks a lot better, but we’ve made changes too.
We’ve added page views, most recently viewed, average time spent viewing, and the ability to track interactions (more on interactions soon) to the top of the analytics page.
Track who views your page and what they do
A new tab for viewers helps you track the people who view a page and how often. Before this was based on the location of each viewer, not the person.
This is helpful when sending your page to multiple people and wanting to understand how each person consumes your content. All these little details help build context on your buyer.
Click into individual sessions and see all the session details, including the last action the viewer has taken.
This more detailed view will eventually show when they click away from a page, whether they expanded an accordion to read additional content, selected a line item on the quote block, and more.
New filters
Not only has the analytics area for individual pages had a massive visual overhaul. But we’ve also introduced new filters.
Filter by the last week, last month, or 12 months of data to see the views over time.
Coming Soon
Qwilr has always tracked who is viewing your documents, what they click on, and how long they spend on the page and where. But soon, every Qwilr page will come with more, including:
Interactions ✨
We’re introducing a new Interactions tab that will show where time is being spent on a page that goes far beyond surface level insights.
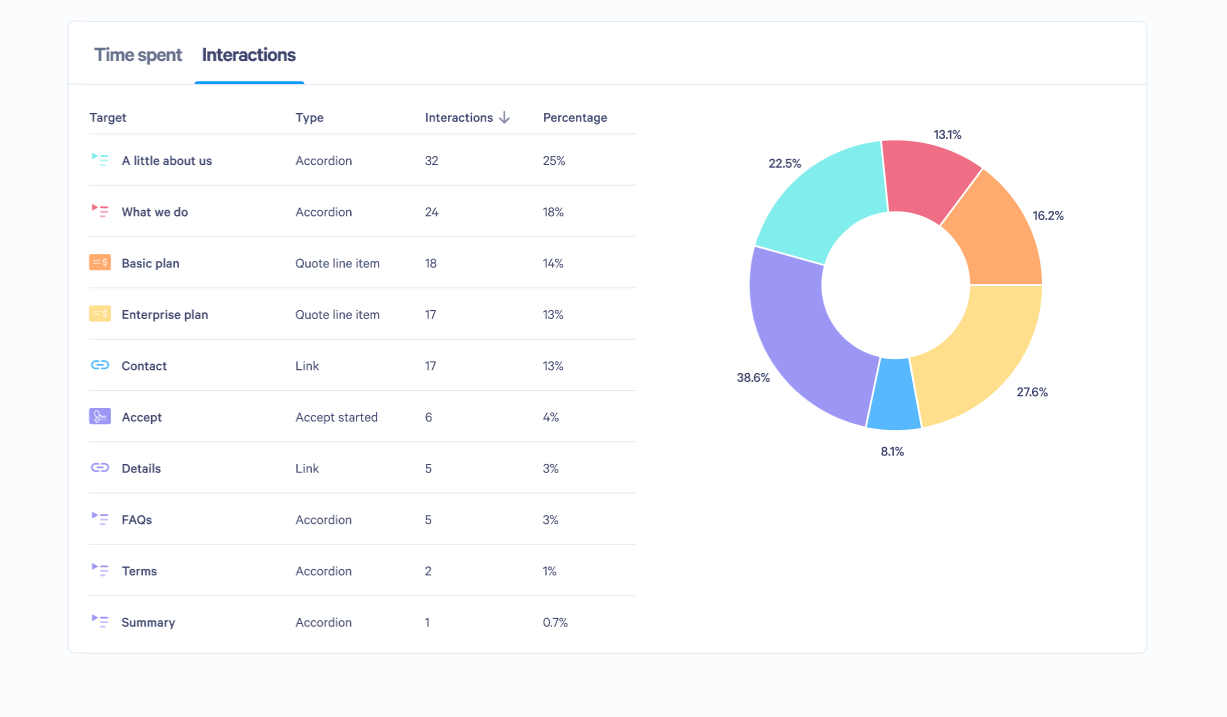
The number of interactions you can track on any Qwilr page will continue to grow, including specific details like what pricing variables a prospect has toggled between, whether they’ve started to sign the page and abandoned it, if they’re viewing Terms & Conditions, and more. You’ll see an announcement on this very soon.
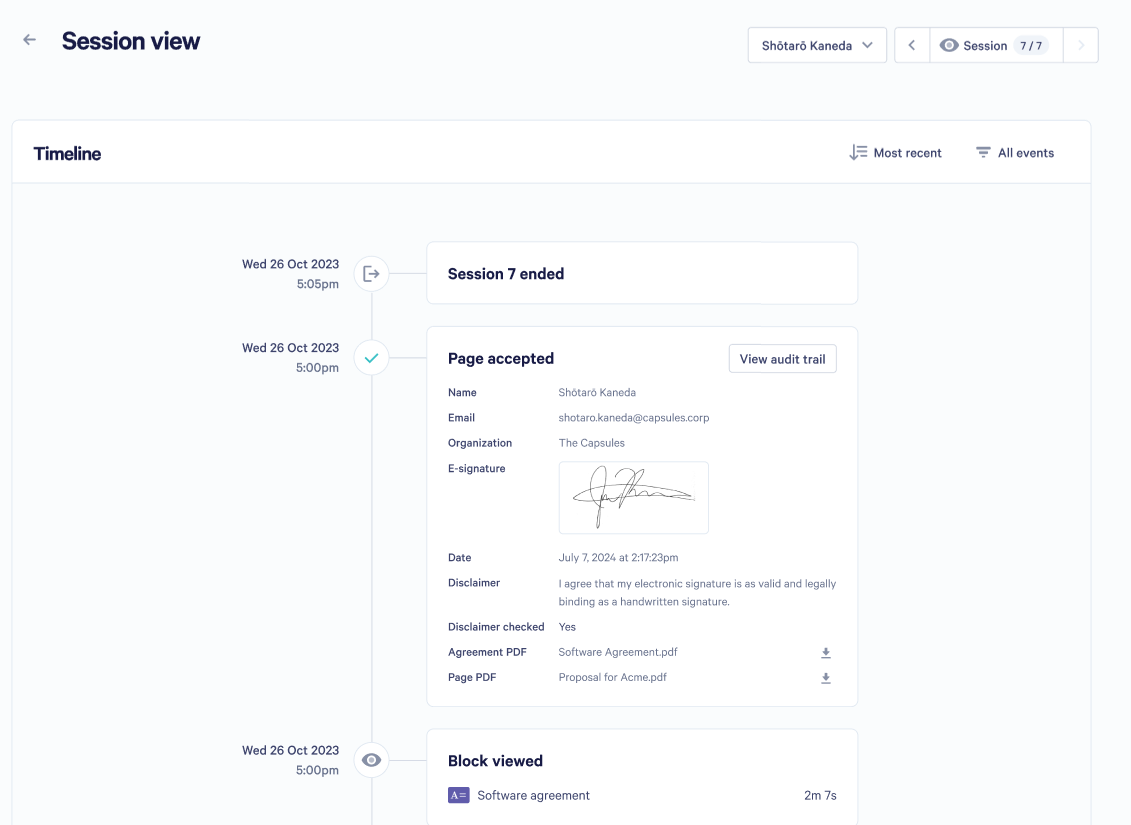
A new activity timeline
One of the updates we’re most excited about releasing this year is the new activity timeline. The introduction of a timeline brings the entire history of the page and all the interactions together. It will show things like:
- When the page was first created
- Page status changes (when the page goes from draft to live and is ultimately accepted or declined)
- Pages viewed, who is viewing them (and where they're located)
- Engagement level changes
- More specific activity, such as whether or not a viewer interacted with a pricing quote or clicked on an ROI calculator
- A detailed timeline that shows what each person has done during a session
Notifications
Having all of this data is excellent, but being able to act on it is what matters most.
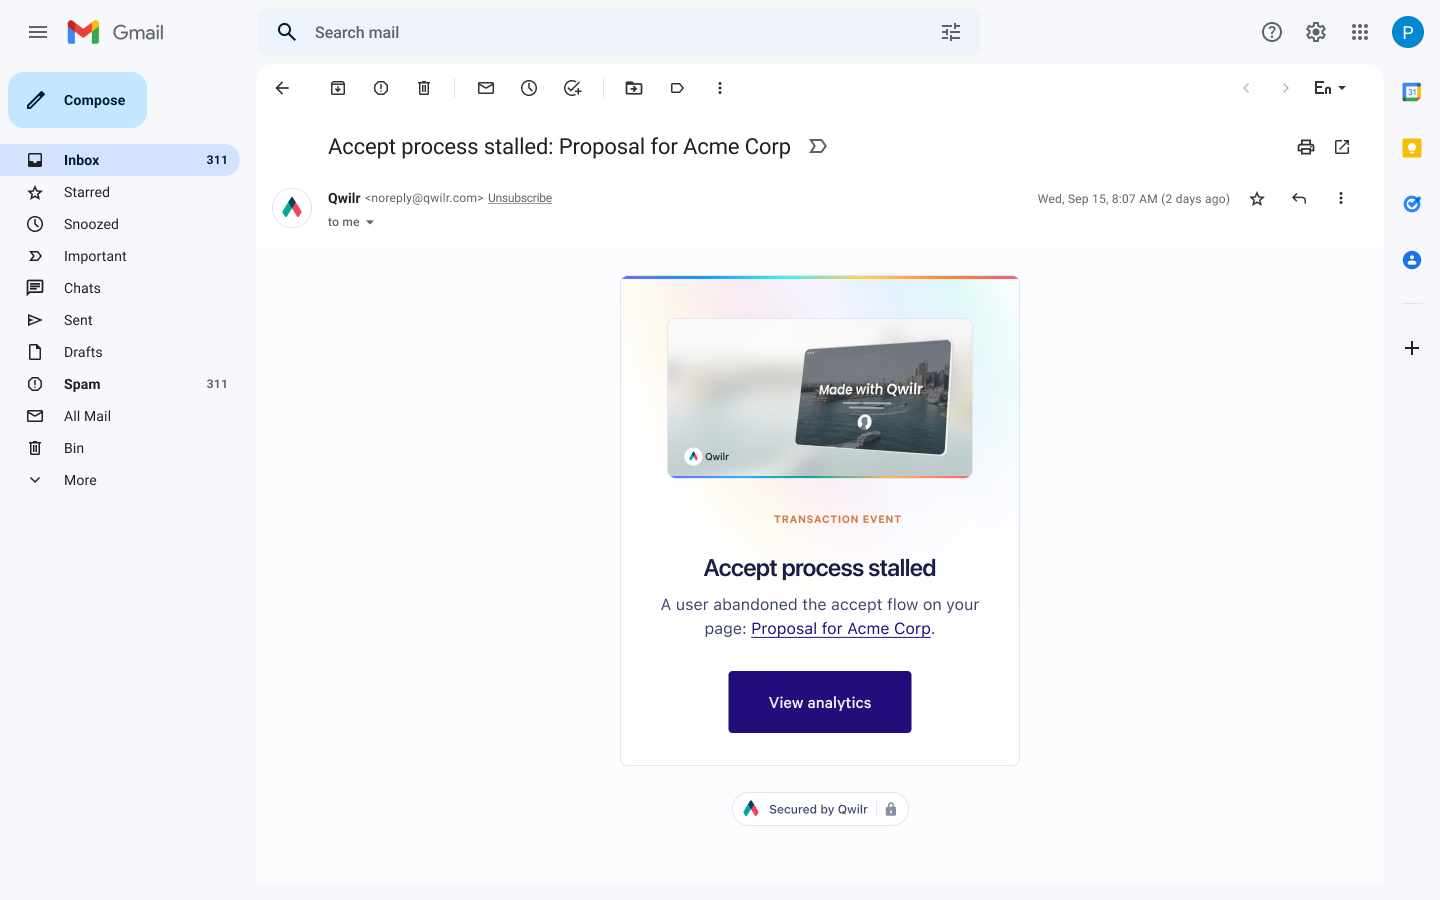
We’re adding notifications so you can act quickly when a transaction happens, someone signs, or if the process has been stalled. Or even better, if someone comes back to view a proposal weeks or months later, you’ll get notified too.
If you’ve set up engagement levels, then you can get notified when a buyer becomes highly engaged or disengaged.
We’re also updating the email notifications menu to make it more clear whether you want to be notified on every view, just the first view, or something a bit more customized. More details to come on how notifications will work very soon.
How to stay updated
To keep up with our newest features and releases, make sure to follow our Product Updates, and follow us on Linkedin.
Need more help understanding the newest features? Our customer support team is always available to answer questions and ensure you fully leverage all of the newest product features.
About the author

Tania Clarke|Product Marketing Leader
Tania is a former Head of Product Marketing at Qwilr, with experience across positioning, sales enablement and competitive intelligence.