Consulting Report Template
Present thorough analysis and insights with the detailed Consulting Report Template – convey key findings, strategic advice, and actionable steps effectively.
About this template
Deliver insights with our Consulting Report Template. Ideal for presenting findings, recommendations, and analysis, this template ensures effective communication and reinforces your consulting expertise.
Equip your consulting business with a professional report template that conveys your insights in a clear, organized manner. Our Consulting Report Template fosters client satisfaction by illustrating the value and impact of your recommendations.
What's included?
- Project summary
- Quote
- Research and business mapping
- Contact
Why Qwilr?
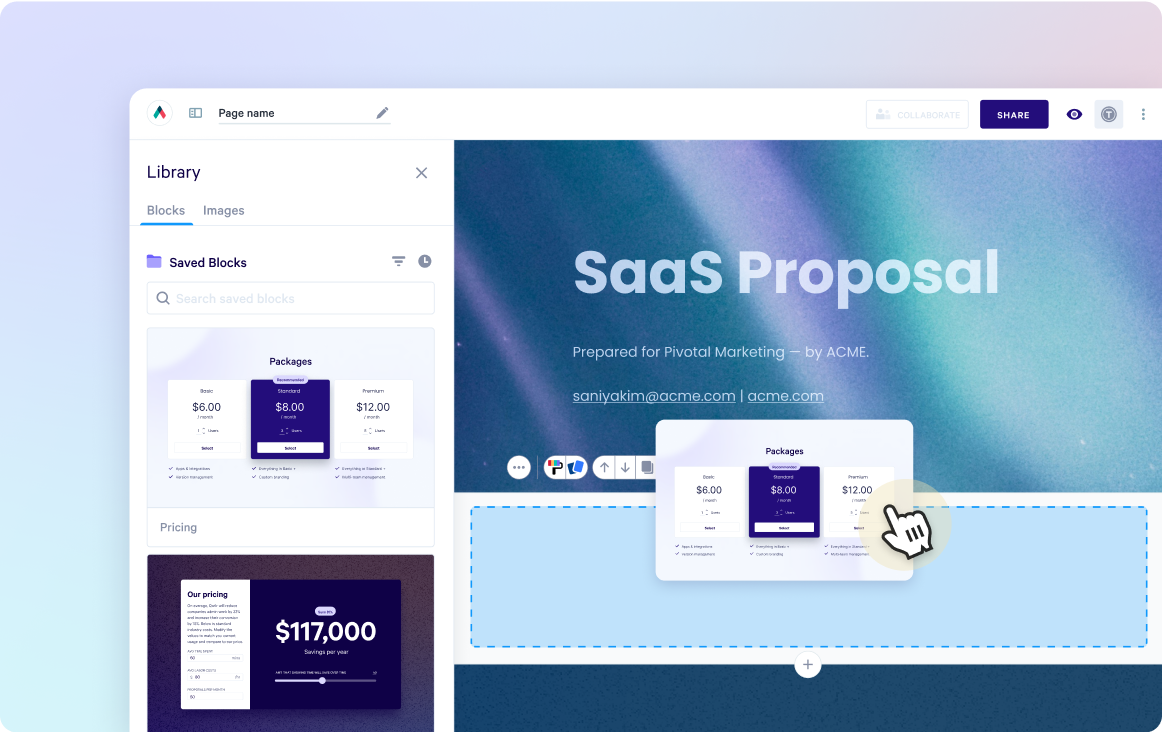
Design interactive proposals
Impress buyers with interactive proposals that stand out. Qwilr’s drag-and-drop editor makes it easy to create on-brand, stunning collateral — no design skills needed. Add videos, dynamic pricing, and ROI calculators to deliver a unique experience, while automated brand customizations ensure every proposal looks professional.
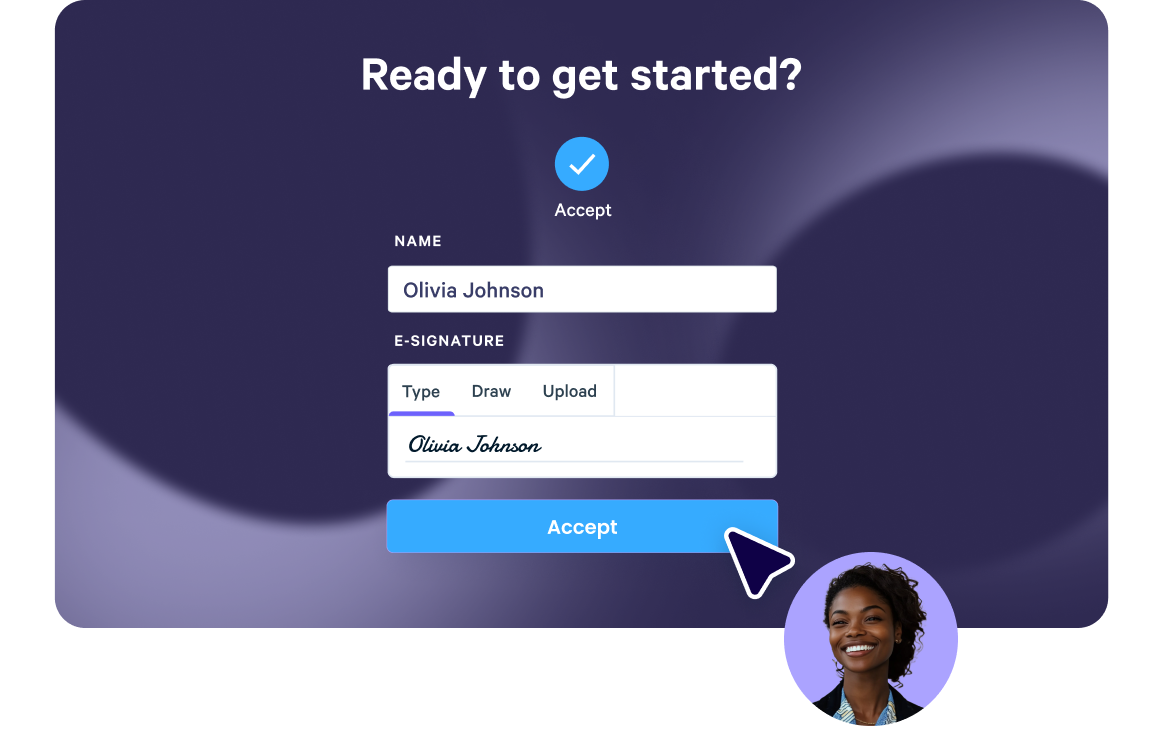
Built-in e-sign functionality
Combine stunning proposals, plain-text agreements, and secure e-signatures in one tool. Add print-friendly agreements alongside dynamic content and collect legally compliant e-signatures with ease. Track progress, capture multiple signatures, and close deals faster with Qwilr’s integrated e-sign functionality.
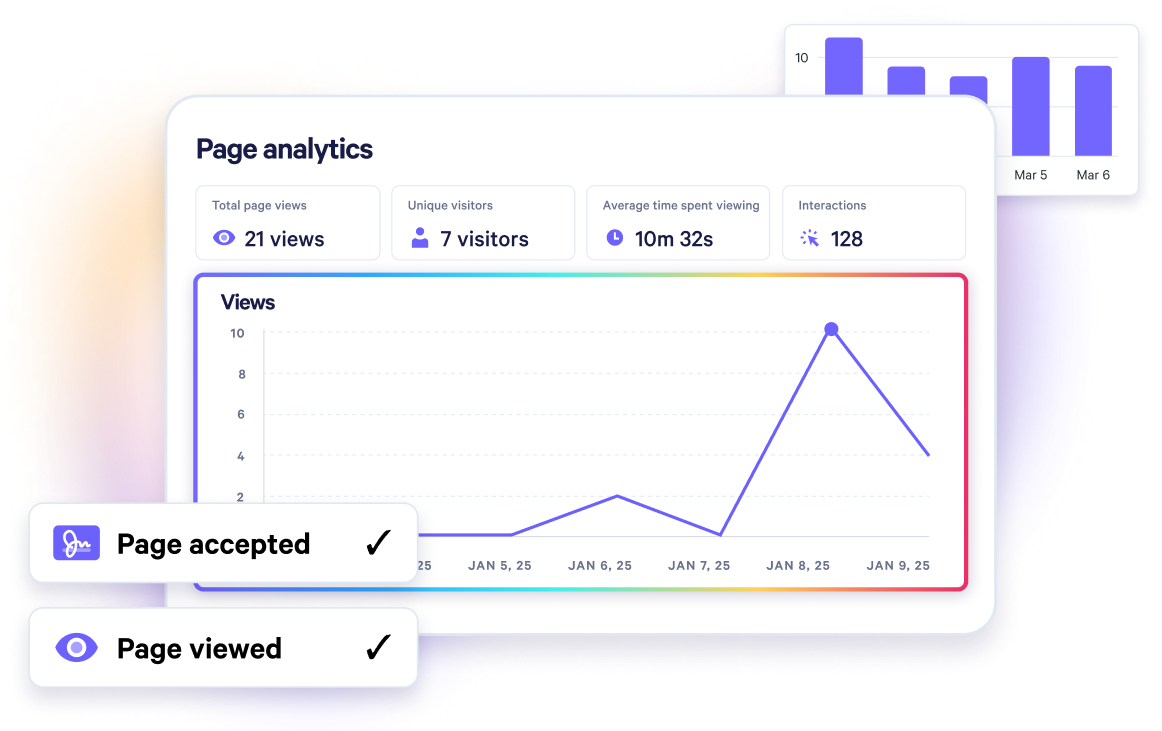
Real-time proposal analytics
Qwilr’s analytics provide full visibility into buyer engagement. Track when proposals are opened, signed, or shared, and get instant notifications for key buyer activities. See what buyers click on, how they engage, and prioritize follow-ups based on real-time insights—all designed to help close deals faster.
Templates for every use case
Explore templates for sales, marketing, customer success, sales enablement and more.
Explore proposal templates


Frequently asked questions
Writing a consulting report requires a structured approach that includes research, analysis, and recommendations. To write an effective consulting report, follow these steps:
- Define the scope of the problem or opportunity
- Gather relevant data and information
- Conduct a thorough analysis of the data
- Develop recommendations based on the analysis
- Provide supporting evidence for your recommendations
An effective consulting report format includes the following sections:
- Title page or hero section
- Table of contents
- Executive summary
- Introduction
- Background information
- Analysis
- Recommendations
- Conclusion
- Appendices
The executive summary should provide a concise and comprehensive overview of the consulting report. It should include a summary of the problem or opportunity, the research methodology used, the findings and recommendations, and any key supporting evidence and data. The executive summary should be clear, concise, and written in a language that is easily understood by the target audience.